Quick summary
How to turn discounts from a transactional decision into a strategic system that reveals revenue quality, retention patterns, and long-term business health.
Table of contents
How Discounts Impact SaaS Revenue and Retention (And Why You Need Visibility)
A customer asks for 30% off to close the deal. Your sales team says yes. Three months later, that customer churns. Was the discount the problem?
Here’s what the data says: Research from Paddle shows that discounts can slash customers’ long-term value (LTV) by 30%, increase churn, and dampen their willingness to pay full price later.
But here’s the twist: A study by ProfitWell found that optimally structured discounts can actually increase LTV by 30% despite the initial revenue reduction.
Same 30% number. Completely opposite outcomes.
The difference? Visibility.
This happens every day in SaaS companies. Discounts are approved in Slack threads, buried in CRM notes, negotiated over email. Each decision feels rational in the moment close the deal, save the renewal, hit the quarter. But these tactical choices create strategic consequences that most teams only see when it’s too late.
Churn rises. Lifetime value drops. Net revenue retention stalls. And nobody can explain why.
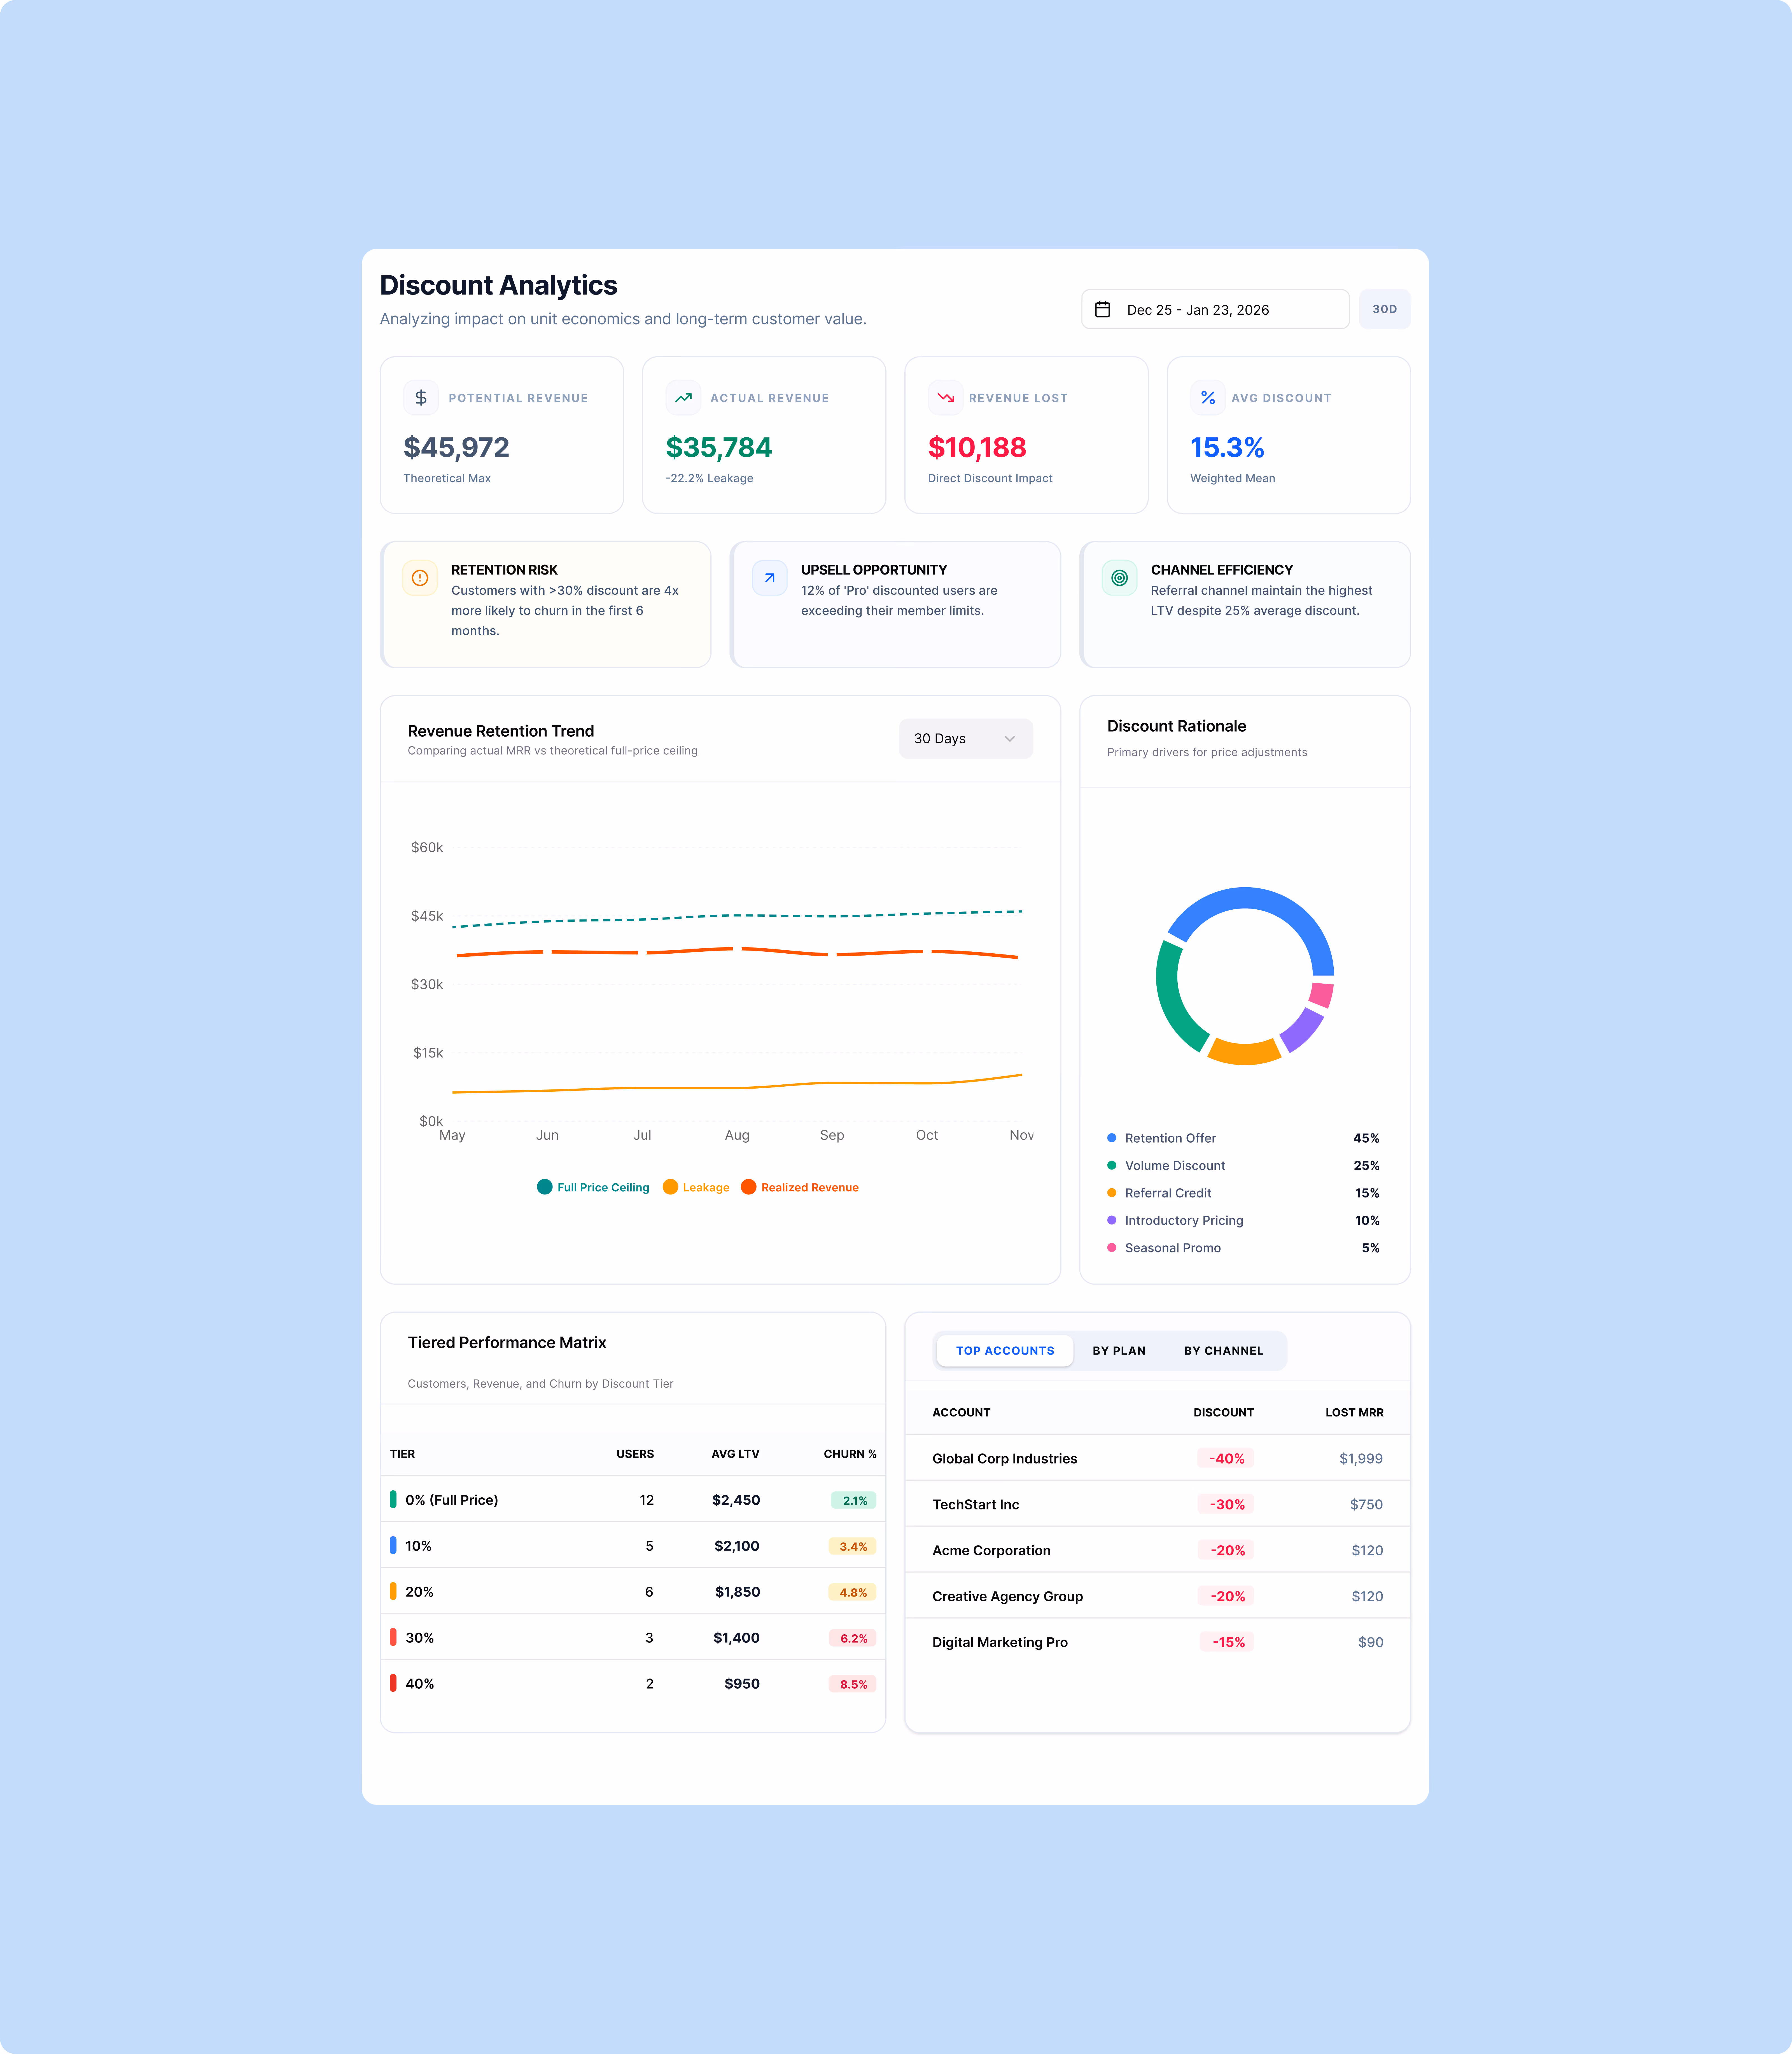
The Revenue Leakage Dashboard reveals the gap between potential and realized revenue.
Why Discounts Are Invisible (And Why That’s Killing Your Business)
According to Recurly’s 2025 Churn Report, the average churn rate for B2B SaaS companies is 3.5%. But here’s what most companies don’t realize: a significant portion of that churn is directly linked to how they discount.
The problem isn’t that discounts are inherently bad. The problem is that most companies have no idea what their discounting behavior actually looks like or what it’s costing them.
Discounts happen everywhere:
- Sales calls to close competitive deals
- Renewal conversations to prevent churn
- Expansion negotiations when customers want more seats
- Support escalations when customers threaten to leave
- End-of-quarter pushes to hit revenue targets
But they’re approved in different systems, by different people, for different reasons. There’s no unified view of:
- Who’s getting discounts (which customer segments)
- Why they’re getting them (competitive pressure? volume commitment? retention play?)
- How much revenue you’re giving away
- What happens next (do these customers stick around? expand? churn faster?)
The result? Teams are flying blind.
You might be over-discounting to low-value segments who churn anyway. Training customers to wait for discounts before buying. Eroding margins without realizing it. Creating pricing inconsistency that confuses prospects and demoralizes full-price customers.
And because no one’s connecting the dots, the pattern repeats. Quarter after quarter.
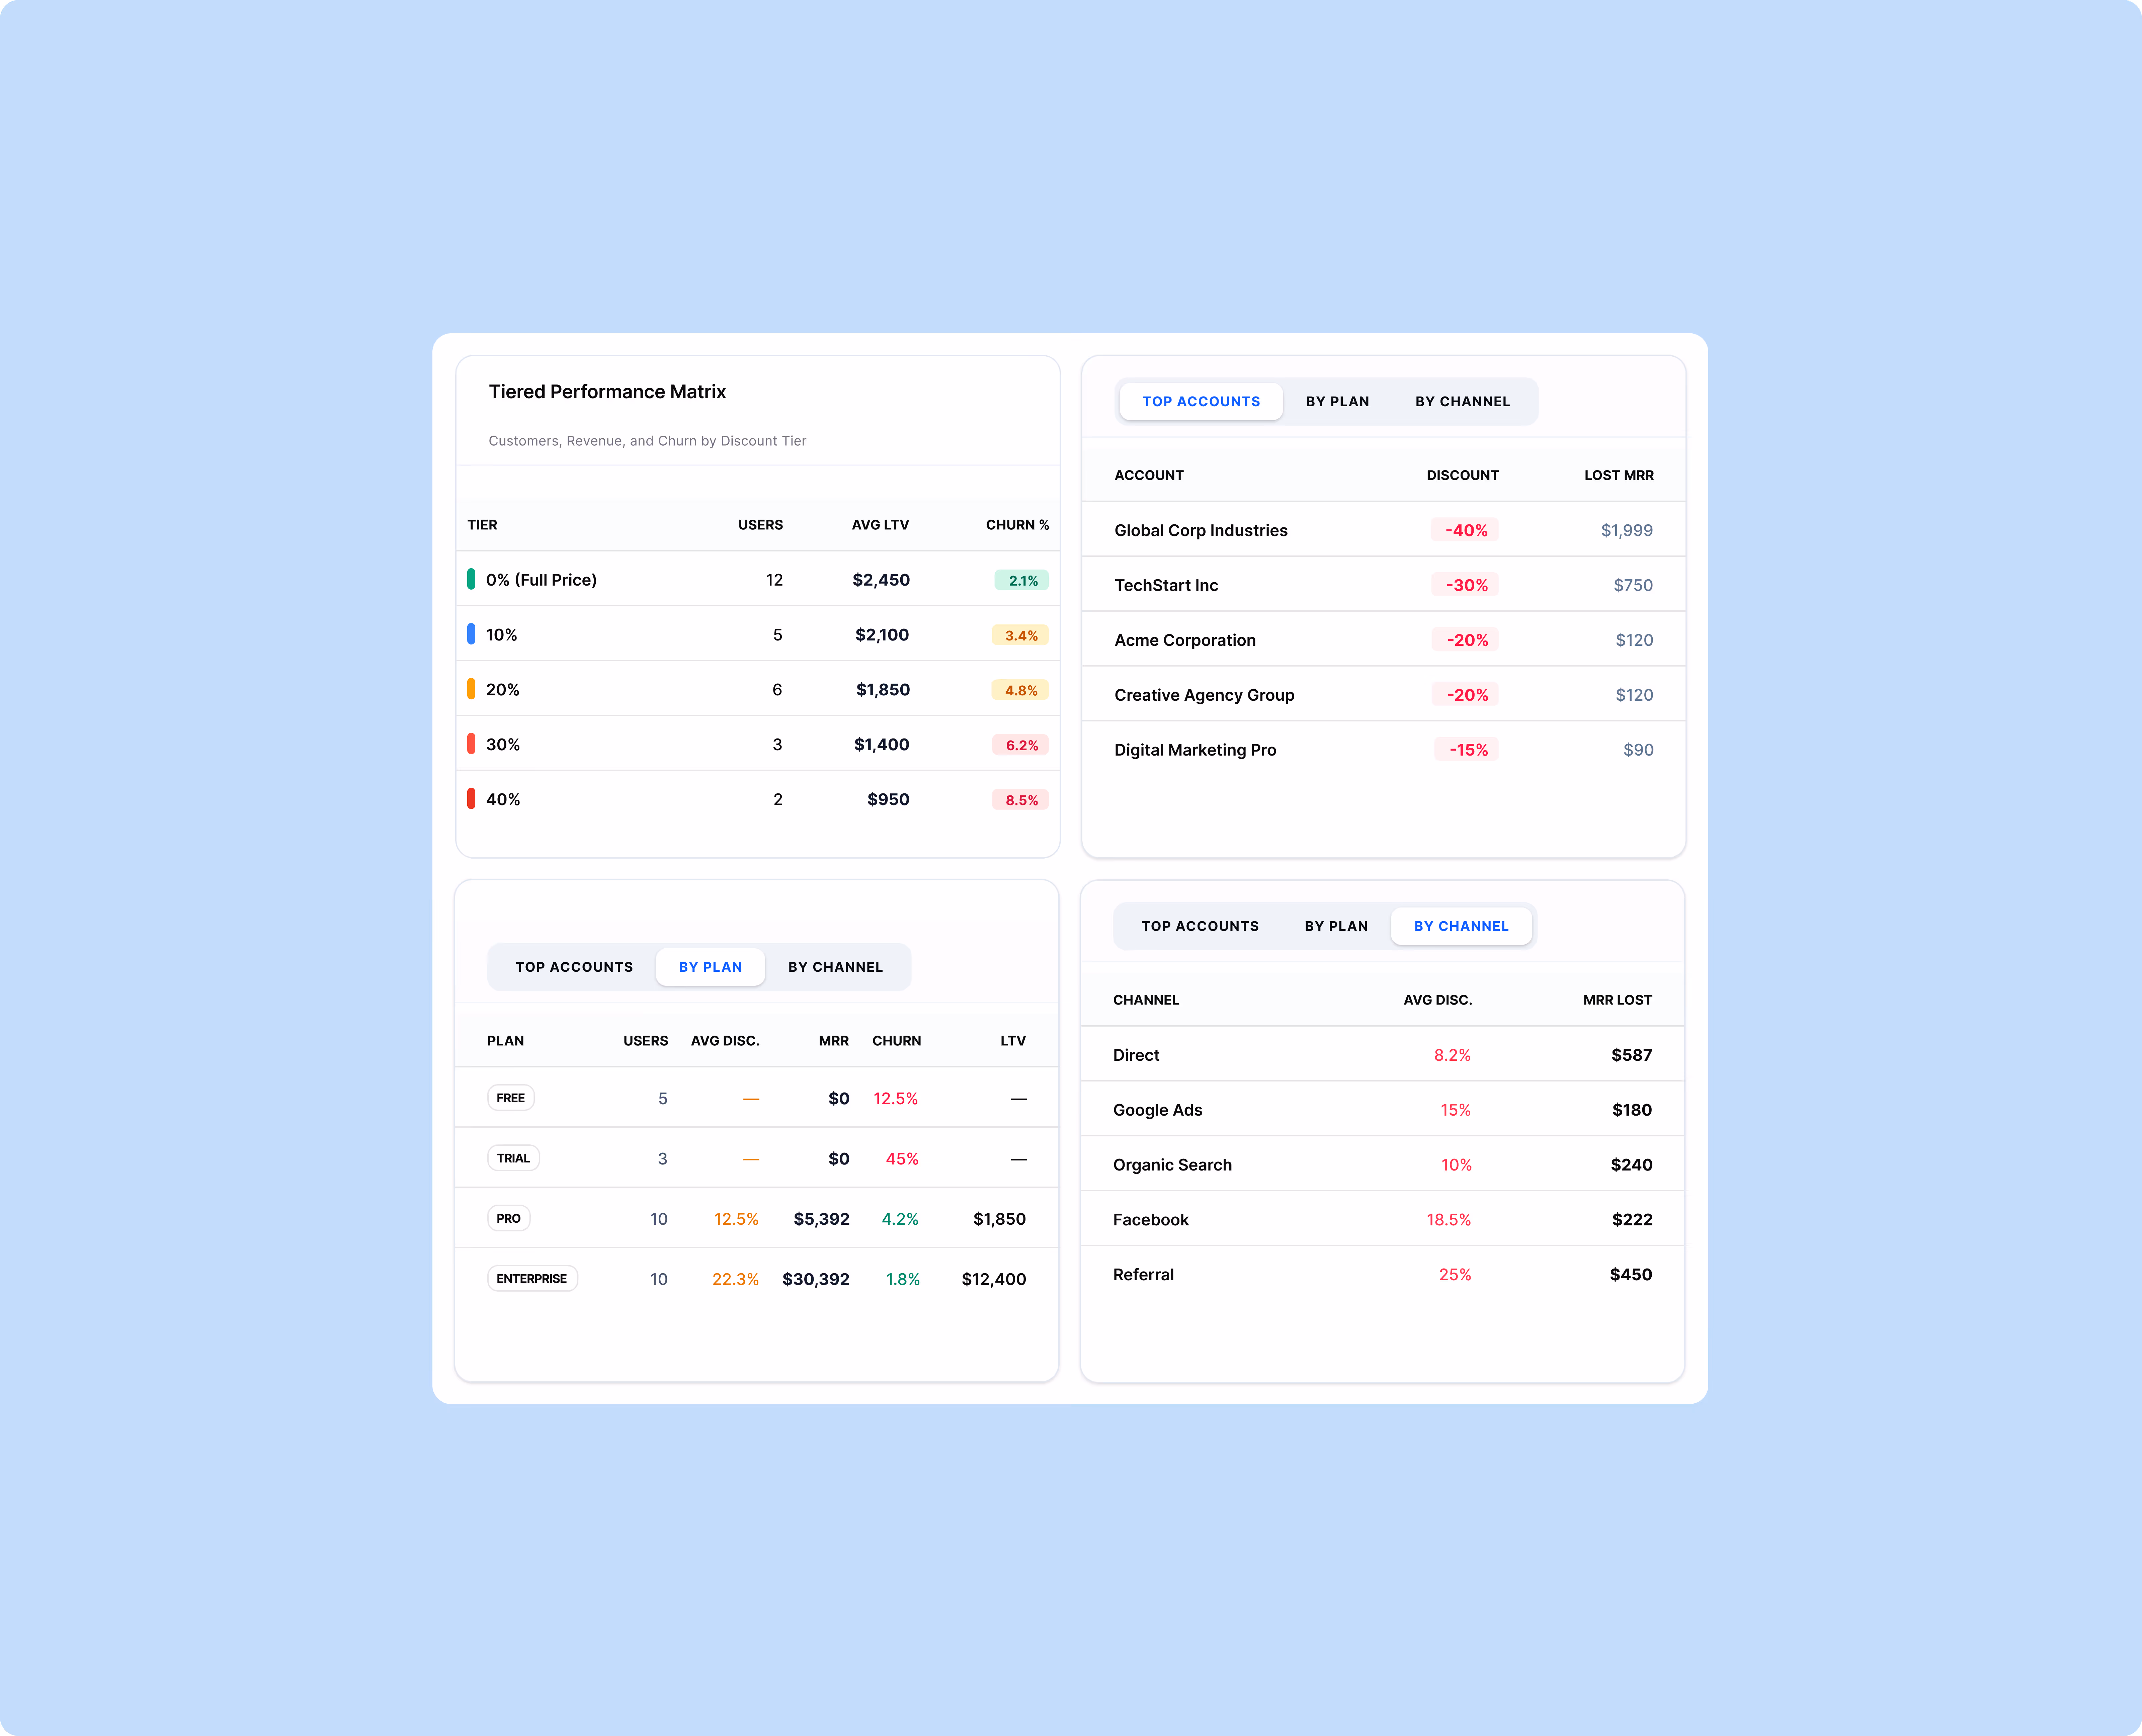
The performance matrix connects discount levels directly to retention and LTV.
What Good Discount Visibility Looks Like
Before you can fix the problem, you need to see it clearly. The best SaaS companies track discounting across five key dimensions:
1. Discount Distribution
What to track:
- Percentage of deals with discounts (by plan tier, customer segment, region)
- Average discount depth (10%, 20%, 30%+)
- Discount frequency trending over time
Industry benchmark: Companies like Slack, Zoom, and HubSpot have standardized 15-20% discount for annual prepayment versus monthly billing. If you’re consistently giving 30%+ discounts just to close monthly deals, you’re fighting a different battle.
Why it matters: If 80% of your deals are discounted, you don’t have a pricing strategy you have a negotiation process. And if discounts are trending up every quarter, you’re slowly training your market to expect them.
2. Discount Reasons
What to track: Tag every discount with a reason code:
- Competitive pressure
- Volume/multi-year commitment
- Renewal retention play
- Customer success escalation
- End-of-quarter push
- Startup/non-profit program
Real example: Salesforce implements a sliding scale where discounts increase with user count, tying discounts to clear business value (more users = more stickiness).
Why it matters: “Competitive pressure” might be legitimate or it might be lazy sales objection handling. When you tag every discount, patterns emerge. If 60% of your discounts are “end-of-quarter push,” you’ve got a sales execution problem, not a pricing problem.
3. Customer Behavior Post-Discount
What to track:
- Churn rate: discounted vs. full-price customers
- Time-to-churn: do discounted customers leave faster?
- Expansion rate: do they grow with you or stay flat?
- Support ticket volume: are they higher-touch?
Industry insight: Customers paying more than $250 per month have the lowest churn rates. Why? Higher price creates higher commitment. When you discount a $400/month product down to $250, you’re not just losing $150 you’re potentially moving that customer into a higher-churn segment.
Why it matters: This is where the truth emerges. If customers who got 25% off churn at twice the rate of full-price customers, you’re not “investing in the relationship” you’re subsidizing future churn.
4. Revenue Quality
What to track:
- Net Revenue Retention (NRR) by discount tier
- Customer Acquisition Cost (CAC) payback period
- Lifetime Value (LTV) comparison: discounted vs. non-discounted cohorts
- LTV:CAC ratio by segment
Industry benchmark: A strong SaaS business typically aims for an LTV:CAC ratio of 3:1. If your discounted customers are delivering 1.5:1 while full-price customers hit 4:1, you need to see that split.
Why it matters: Two customers at $500/month look identical in your MRR dashboard. But if one paid full price and the other got 40% off, their contribution to business health is completely different. Revenue quality matters as much as revenue quantity.
5. Sales Team Patterns
What to track:
- Which reps discount most/least
- Win rates with vs. without discounts
- Deal velocity: do discounts actually speed up deals?
Why it matters: If one rep closes 60% of deals at full price while another discounts 80% of the time, you don’t have a pricing problem you have a training problem. The data points you to the fix.
The Insights That Change Behavior
Here’s where visibility becomes powerful. When you surface the patterns, behaviors change. Here are three scenarios based on real data:
1: The Renewal Trap
What the dashboard showed: 40% of customers who churned had received a renewal discount in the previous cycle.
The data context: According to Recurly, involuntary churn in B2B SaaS averages just 0.8%, yet fixing it can lift revenue by 8.6% in year one. But voluntary churn from discounted renewals? That’s a different beast.
The insight: Discounting to retain at-risk customers delays churn but doesn’t fix the underlying problem. These customers weren’t getting value you just made it cheaper to postpone the inevitable.
The action: The team shifted from reactive discounting to proactive success interventions. Instead of offering 20% off at renewal, they invested in onboarding audits, usage reviews, and feature adoption campaigns 90 days before renewal. Result: Churn dropped by 23%, and the customers who stayed were actually using the product.
2: The Segment Mismatch
What the dashboard showed: SMB customers received an average 25% discount but churned at 2x the rate of enterprise customers who paid full price.
The data context: For B2B Enterprise: annual churn between 11% and 22% is GOOD, and less than 6% is GREAT. But this company’s discounted SMBs were churning at 45% annually.
The insight: The company was subsidizing a segment that fundamentally didn’t stick. The product was too complex for SMBs, and discounts couldn’t solve the fit problem.
The action: They raised SMB pricing by 15%, tightened discount approval to require VP sign-off for anything over 10%, and invested in product-led onboarding to reduce friction. Some SMBs churned immediately but the ones who stayed were better fits. Gross margin improved by 12 points, and 6-month retention went from 55% to 78%.
3: The Value-Add Alternative
What worked: Instead of pure discounts, some companies add value.
Real examples: Asana might include free training or implementation support rather than cutting base prices, Monday.com bundles additional features during promotional periods, and Tableau includes education credits with certain enterprise packages.
The insight: When a SaaS company in the marketing automation space analyzed their data, they found that customers who received implementation support (valued at $5K) had 40% higher 12-month retention than customers who got a $5K discount. Same cost to the company. Completely different outcome.
The action: They stopped offering pure price cuts for deals over $50K ARR. Instead, they bundled onboarding, training, and quarterly business reviews. Discounted revenue dropped by 18%, but NRR increased from 95% to 112% because customers actually knew how to use the product.
How to Build This (Practical Steps)
You don’t need a fancy BI tool or a data team to start. Here’s how to build discount visibility, even if you’re resource-constrained:
1: Centralize the Data
- Pick one source of truth Add a “Discount %” field and “Discount Reason” dropdown in your CRM (Salesforce, HubSpot, Pipedrive)
- Make it mandatory Deals can’t be marked “Closed Won” without these fields filled
- Add value-type tracking Tag whether it’s a pure discount or value-add (training, extended trial, bundled features)
- Start logging Even if historical data is messy, start clean from today
Pro tip: Successful SaaS companies establish clear discount approval matrices with defined discount tiers and appropriate approval levels.
2: Connect to Outcomes
Link discount data to what happens next:
- Churn: Did discounted customers renew? Use cohort analysis like TouchNote, which achieved a 56% increase in their save rate within a year by studying churn patterns through cohort analysis.
- Expansion: Did they buy more seats/features?
- Support load: How many tickets did they submit?
- Payment success: Track involuntary churn separately remember, 10% of revenue is lost monthly due to involuntary churn from declined cards and payment issues.
3: Build the Dashboard
Create views for:
- Discount distribution by segment, plan, region
- Churn rate by discount tier (0%, 1-10%, 11-20%, 21%+)
- LTV comparison: discounted vs. non-discounted cohorts
- NRR by segment: Are enterprise discounts driving expansion while SMB discounts drive churn?
- Rep-level patterns: Who’s discounting and what’s their close rate?
Set a review cadence: Make this a monthly leadership ritual. The best companies review discount data in their monthly business reviews, right alongside ARR and churn.
4: Create Accountability
- Set discount policies: e.g., “Discounts >15% require VP approval; >25% require CEO approval”
- Build approval workflows: Real-time alerts in Slack when high discounts are requested
- Create exception paths: Annual prepayment gets automatic 16% discount; multi-year gets 20%
- Share the data: Make discount patterns visible to the whole revenue team
- Celebrate good behavior: Recognize reps who close deals at full price with strong value articulation
Real-world benchmark: According to Profitwell’s pricing case studies, annual prepayment discounts of 15-20% work because they improve cash flow, reduce churn risk, and offer genuine value to both parties.
The Strategic Shift: From Reactive to Intentional
Here’s what most people get wrong: they think the goal is to eliminate discounts. It’s not.
The goal is to make discounting intentional, not reflexive.
Discounts can be smart:
- Locking in a multi-year commitment from an enterprise customer (Salesforce’s playbook)
- Landing a logo that unlocks a new vertical
- Offering annual prepayment discounts that improve your cash position
- Running strategic programs (education, non-profit) that build long-term goodwill
But they can also be destructive:
- Training your market to expect 30% off
- Subsidizing customers who were never going to succeed
- Papering over weak value propositions with price cuts
- Creating a discount-dependent sales culture
The data tells the story:
- Customers attracted to discounts tend to be users with higher price sensitivity and higher rate of churn
- But optimally structured discounts can increase LTV by 30% when tied to the right behaviors (annual commit, feature adoption, expansion)
The difference? Structure and visibility.
When you can see the patterns who gets discounts, why, and what happens next you can make the trade consciously. You can say:
“Yes, we’ll give this enterprise customer 20% off for a 3-year commit. Historical data shows our multi-year customers expand at 140% NRR and churn at 4% vs. 12% for annual contracts. The discount pays for itself by month 18.”
Or:
“No, we won’t discount this SMB deal. Customers in this segment who get 20%+ discounts churn 58% of the time within 12 months. We’re better off letting them walk and investing that sales time in a better-fit prospect.”
That’s pricing as product strategy. Not pricing as panic.
Your Discount Visibility Checklist
You don’t need perfect data to start. You need one thing: a commitment to making discount decisions visible.
- Add discount % and reason fields to your CRM
- Make them mandatory for deal closure
- Brief your sales team on why this matters
- Pull your first discount report: what % of deals are discounted?
- Compare churn rates: discounted vs. full-price customers
- Calculate LTV:CAC by discount tier
- Identify your “worst offender” segment (high discount + high churn)
- Build your first discount dashboard
- Set discount approval thresholds
- Run your first discount review meeting with revenue leadership
- Pick one improvement area (e.g., “reduce SMB discounts over 15%”)
- Measure impact of Month 2 changes
- Share results with the team
- Adjust policies based on data
- Make discount review a permanent monthly ritual
The Benchmark to Beat: Remember, the average B2B SaaS churn rate is 3.5%, and a healthy LTV:CAC ratio is 3:1. If your discounted cohorts are performing worse than these benchmarks, you’ve found your starting point.
The Most Expensive Discount
The most expensive discount isn’t the one you give. It’s the one you give without knowing why or what it costs you in the long run. Start tracking. Start measuring. Start making your pricing decisions visible. Because in SaaS, what you can’t see will eventually kill you.