Article
5 UX Mistakes That Are Quietly Hurting Your SaaS Dashboard (With Real Fixes)
5 UX Mistakes That Are Quietly Hurting Your SaaS Dashboard (With Real Fixes)
Five common SaaS dashboard UX mistakes that quietly weaken activation and retention, plus practical fixes and ways to measure the impact.
Table of contents
5 UX Mistakes That Are Quietly Hurting Your SaaS Dashboard (With Real Fixes)
You shipped the dashboard. The features work. The data loads. So why are users still churning after their first week?
Here’s the uncomfortable truth: most SaaS dashboards don’t fail because of missing features. They fail because the experience feels broken, even when everything technically works. Users land on a wall of charts, can’t find what matters, and quietly leave without ever saying a word.
I’ve spent over five years building B2B SaaS products from zero to scale, starting with Apploye, where I helped build the product foundation from scratch and shaped everything from onboarding flows to desktop app UX. Across every product I’ve worked on, from field service tools to Shopify apps, the same dashboard UX problems keep showing up.
These are the five I see most often, and more importantly, how to actually fix them.
Visual guide: Each section below includes a before/after comparison so you can see the problem and the fix side by side. If you want to study how real products handle these patterns, browse Mobbin and search for “SaaS dashboard” or “analytics dashboard” to benchmark against live examples.
1. Dumping Every Metric on the First Screen
This is the most common SaaS dashboard design mistake, and the hardest to resist.
Product teams spend months building analytics, so they want to show all of it. The result is a dashboard that looks impressive in a demo but overwhelms real users. When everything is highlighted, nothing is.
I hit this wall early at Apploye. We had time tracking data, activity levels, screenshots, app usage, project hours, all useful, all competing for attention on one screen. Users didn’t know where to look first.
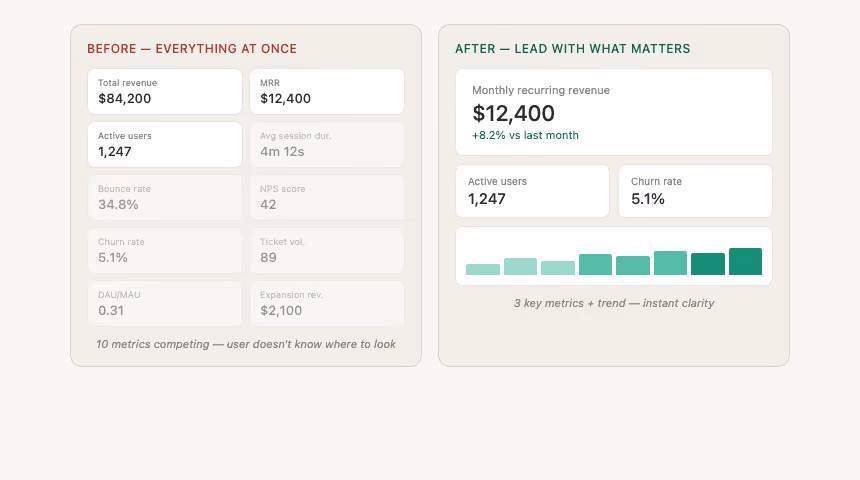
Left: Every metric dumped on the first screen, users don’t know where to look. Right: Lead with MRR, active users, and churn for instant clarity.
Study real examples on Mobbin: Search “dashboard overview” or “analytics home” and notice how the best products lead with 2 to 3 numbers, then push everything else behind a click.
What actually works:
Lead with the 2 to 3 metrics that answer the user’s most urgent question: “Is everything on track right now?” Push the rest into secondary views or drill-downs. Think of your dashboard like a newspaper front page, headline first, details inside.
Tools to pressure-test this:
- Hotjar or Microsoft Clarity: Session recordings and heatmaps show you exactly where users look and where they don’t. (Here’s my step-by-step Microsoft Clarity friction audit.)
- Amplitude: Use funnel and retention analysis to identify which metrics actually correlate with activation.
- Mixpanel: Event-based tracking shows which dashboard elements drive deeper engagement versus which ones just sit there.
2. Building an Onboarding Flow That Stops at “Welcome”
Most SaaS products treat onboarding like a one-time tour. You get a few tooltip bubbles, a “Welcome to your dashboard!” message, maybe a checklist, and then you’re on your own.
The problem is that dashboard comprehension isn’t instant. A user who just signed up doesn’t interpret a chart the same way a power user does. And if your dashboard doesn’t bridge that gap, first-session confusion turns into first-week churn.
When I was improving activation flows at Apploye, the biggest unlock wasn’t adding more onboarding steps. It was making the dashboard itself easier to understand without onboarding. Contextual labels, inline explanations, and progressive disclosure did more than any product tour.
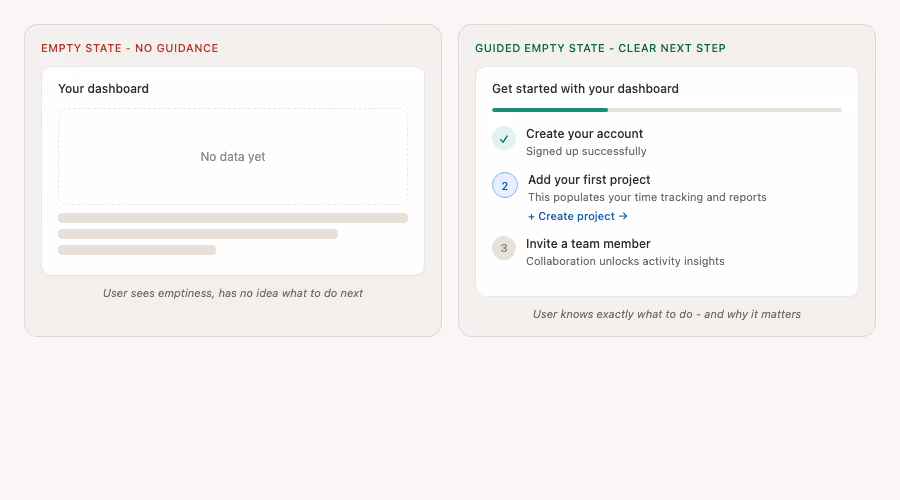
Left: “No data yet” and nothing else, a dead end. Right: A progress checklist that tells users exactly what to do and why each step matters.
Study real examples on Mobbin: Search “empty state” or “onboarding checklist”. The best empty states don’t just say “nothing here” - they guide users toward the action that populates the screen.
What actually works:
Design the dashboard so a first-time user can understand it without external guidance. Then layer onboarding on top for acceleration, not as a crutch. Use empty states wisely. Instead of showing blank charts, tell users exactly what to do to populate them.
Tools to build this right:
- Appcues or Userflow: Build contextual in-app guidance that triggers based on user behavior, not just signup date.
- Figma: Prototype your empty states and first-session experience before building them.
- FullStory: Identify where new users rage-click or drop off inside the dashboard.
3. Making Navigation Work for Your Org Chart Instead of Your Users
Here’s a pattern that silently kills dashboard usability: sidebar navigation that mirrors your internal team structure instead of user workflows.
You’ll see menus labeled by feature area such as “Reports,” “Analytics,” “Settings,” “Integrations,” and “Team Management.” Each one was probably built by a different squad. Makes sense internally. Makes zero sense to a user who just wants to check their team’s hours and export a report.
I see this in almost every B2B SaaS product I consult on. At Fieldservicely, we were deliberate about structuring navigation around tasks users actually perform, “Assign a Job,” “Track Progress,” “Review Completed Work,” instead of product modules.
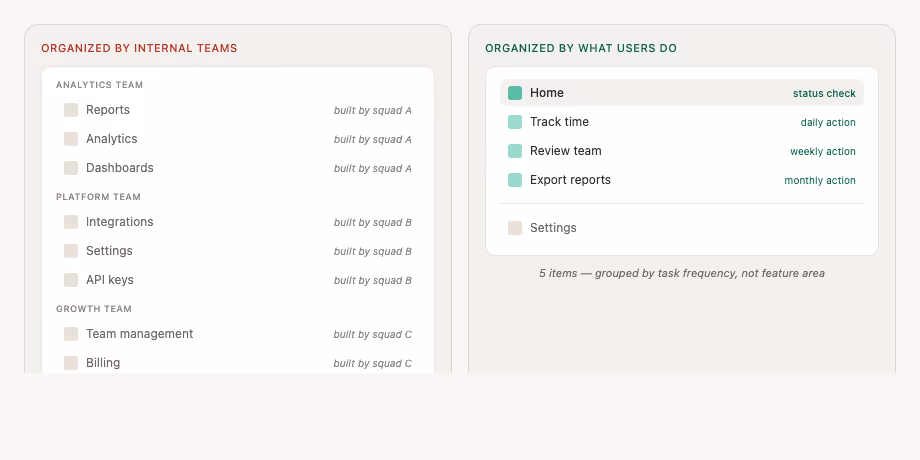
Left: 8 nav items mirroring your internal squads. Right: 5 items grouped by task frequency, with daily actions at the top and settings at the bottom.
Study real examples on Mobbin: Search “sidebar navigation” or “SaaS navigation”. Pay attention to products whose navigation labels describe actions rather than features.
What actually works:
Group navigation by user intent, not feature category. Interview your users, even five is enough, and ask: “Walk me through what you do when you first open the dashboard.” Their answer is your navigation structure.
Tools to validate this:
- Maze or Optimal Workshop: Run tree testing and card sorting studies to see how users naturally group tasks.
- Loom: Record a walkthrough of your current navigation and send it to users for feedback.
- Google Analytics (GA4): Track navigation path analysis to see which pages users actually visit in sequence.
4. Treating Mobile and Desktop as the Same Experience
This one is getting worse, not better. As more B2B SaaS users check dashboards on their phones, field managers, remote team leads, traveling execs, teams are still shipping responsive layouts that just shrink everything down.
A 12-column data table doesn’t become usable by making it horizontally scrollable on mobile. A dashboard that works on a 27-inch monitor needs a completely different information hierarchy on a phone screen.
During the Albait Guests project for Hajj season, supervisors were managing a large distributed workforce using Apploye on mobile, checking GPS locations, verifying hours, and monitoring real-time attendance. We couldn’t just compress the desktop view. We had to rethink what information was critical in the field versus what could wait until someone sat down at a laptop.
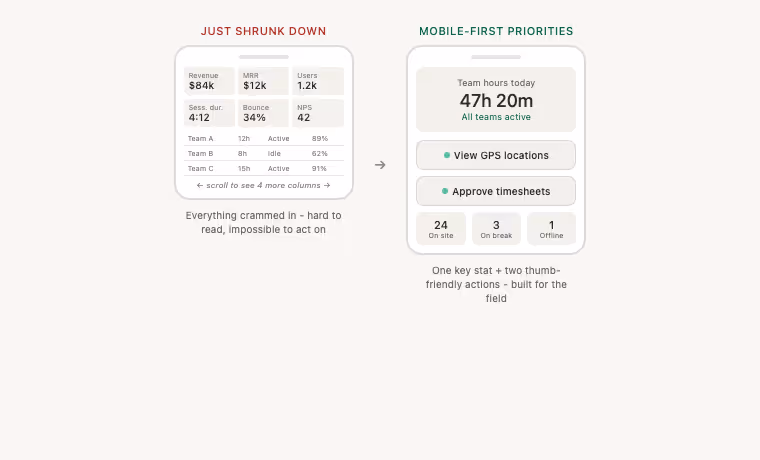
Left: A desktop table crammed into a phone. Right: One hero stat, two thumb-friendly actions, and a quick status overview built for a field manager on the go.
Study real examples on Mobbin: Filter by mobile and search “dashboard mobile” or “field management app”. The best mobile dashboards show a single top-level status with quick-action buttons, not a miniaturized desktop layout.
What actually works:
Don’t adapt. Prioritize. Mobile dashboard users need answers fast, usually one or two things. Design mobile as its own experience: surface top-level status, make key actions thumb-friendly, and push detailed analysis to desktop.
Tools that help you get this right:
- BrowserStack: Test your dashboard across real devices.
- Figma: Design mobile and desktop as separate frames from the start.
- Microsoft Clarity: Segment session recordings by device type and compare behavior patterns.
5. Ignoring the “So What?” Behind Every Data Point
This is the subtlest mistake on this list, and arguably the most damaging to retention.
Your dashboard shows the numbers. But does it tell users what those numbers mean?
A chart showing “Active Users: 1,247” tells me a fact. A dashboard that says “Active users dropped 12% this week, mostly from the Enterprise segment” tells me a story. And a dashboard that then says “View affected accounts” gives me an action.
Most SaaS dashboards stop at the fact. Power users know how to interpret it. Everyone else just stares at it and slowly disengages.
This is something I’m actively shaping in my work on RankFlo, an AI search visibility platform where raw data means nothing unless it’s framed as insight. The whole product value lives in the gap between “here’s a number” and “here’s what you should do about it.”
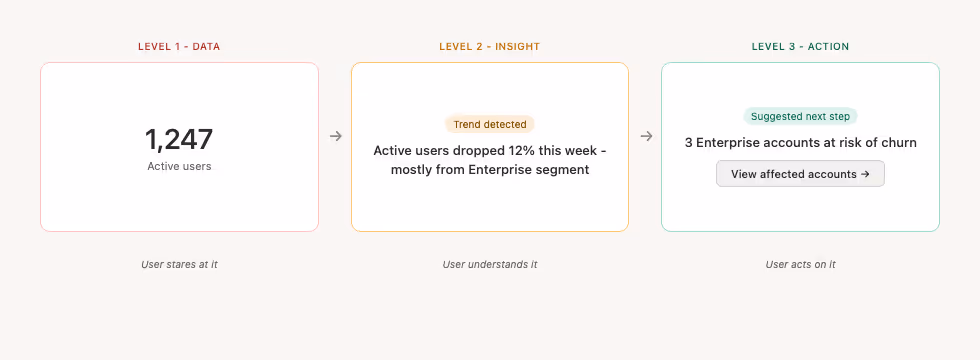
The three levels of dashboard maturity. Level 1: users stare at the number. Level 2: they understand it. Level 3: they act on it. Most SaaS dashboards never get past Level 1.
Study real examples on Mobbin: Search “insights dashboard” or “smart notifications”. The pattern to look for is a metric, a comparison, and a suggested action in the same card.
What actually works:
Add contextual insight layers to your dashboard. Comparisons to previous periods, benchmarks, plain-language summaries, and suggested next steps. You don’t need full AI copilot functionality. Even a simple ”↓ 12% vs. last week” label next to a metric changes everything.
Tools to implement this:
- Amplitude or Mixpanel: Set up automated insights that flag significant changes in user behavior.
- OpenAI API or Claude API: Generate natural-language summaries of dashboard data when you need a smarter interpretation layer.
- Metabase or Looker: Add custom annotations, trend comparisons, and goal tracking without heavy engineering.
The Bigger Picture
Every one of these mistakes shares a root cause: building for features instead of building for understanding.
A dashboard isn’t a data dump. It’s the daily interface between your product and your user’s decision-making. If that interface is cluttered, confusing, or context-free, no amount of feature depth will save your retention numbers.
Start with one fix. Pick the mistake that most closely matches your current dashboard, run one test, and measure the impact on activation or engagement. You’ll be surprised how much a single UX improvement moves the needle.
Want to study how top SaaS products handle all five of these patterns? Browse Mobbin.com and search for terms like “SaaS dashboard,” “onboarding flow,” “empty state,” or “mobile dashboard.” You’ll find real screenshots from hundreds of live products, which is far more useful than generic best-practice articles.
Quick Recap: Your Fix-It Checklist
Mistake → Fix → Measure
Too many metrics → Lead with 2 to 3 key numbers → Track scroll depth and click-through with Hotjar or Clarity
Weak onboarding → Design self-explanatory empty states → Measure time-to-value with Amplitude
Org-chart navigation → Restructure by user intent → Validate with tree testing in Maze
Same mobile/desktop experience → Prioritize mobile as its own view → Test real devices on BrowserStack
Data without context → Add comparisons, labels, and next steps → Track feature engagement in Mixpanel